
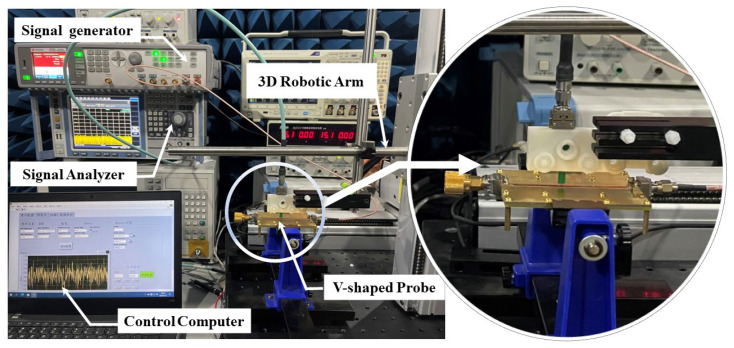
Cover image: Laboratory setup for evaluating an E-field probe's spatial resolution. Image: Khodeir, Yan and Zhao, Sensors 24 (2024), Figure 11, CC BY 4.0. Reproduced unchanged.
To reduce PCB emissions, identify the noise source, trace its current return and coupling path, then change the layout or component that controls that path. A ferrite bead can help one power rail while leaving a radiating cable untouched. A smaller switching loop can reduce local noise while a broken signal return still drives emissions elsewhere.
This guide turns those observations into a working sequence for engineers troubleshooting a board and buyers preparing an EMI component shortlist. It covers emissions from switching supplies, digital interfaces and external cables. The objective is a repeatable diagnosis, an appropriate corrective action and evidence that the complete product improved.
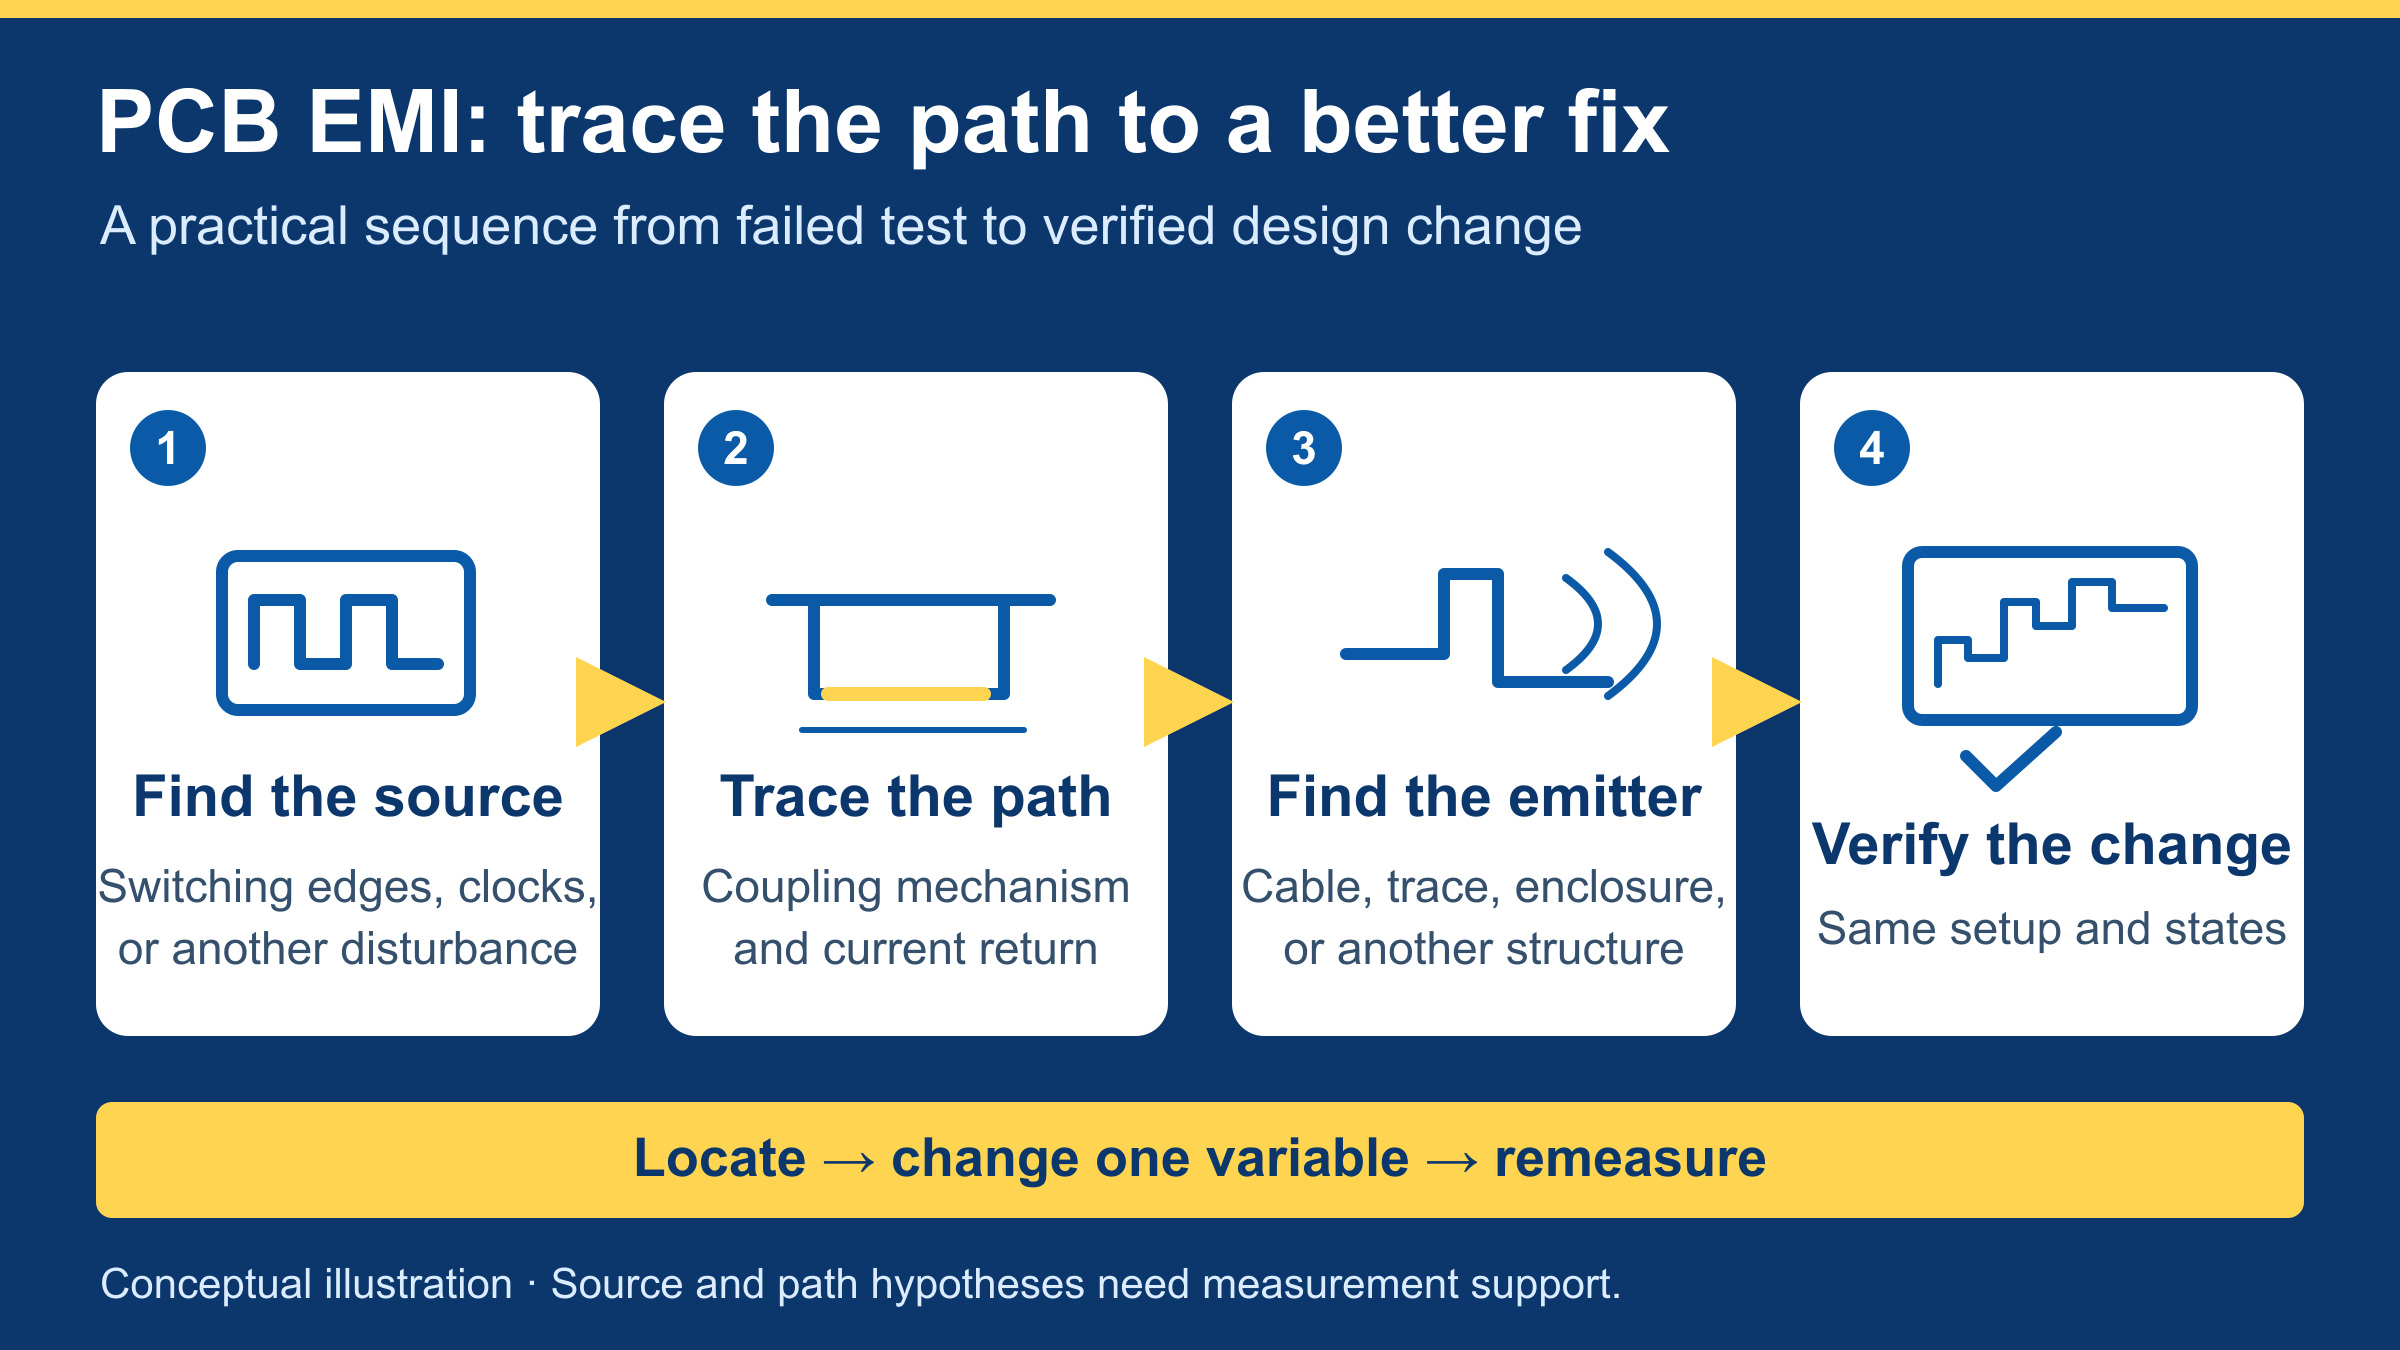
1. Define the failure before changing the PCB
Start with the test record: the applicable product standard and edition, equipment class, failing port, detector, bandwidth, operating mode and frequency. Conducted emissions, radiated emissions and immunity are different investigations. A reset during an ESD test needs a different diagnostic plan from a radiated-emissions peak.
Select the standard from the product's scope rather than its enclosure or the converter's marketing description. The IEC CISPR guide distinguishes product, generic and basic standards; its CISPR 32 entry concerns multimedia equipment. A component or evaluation-board result does not establish compliance of the finished product.
Treat the spectrum as a way to choose an experiment, not as a parts list. Record a suspected mechanism and the observation that would support or reject it.
| Observation | Useful first hypothesis | Next discriminating check |
|---|---|---|
| Regularly spaced peaks | A periodic clock, switching event or data pattern contributes | Change one permitted clock or operating mode and see whether the peak pattern follows |
| A broad envelope around faster ringing | Switching transitions and a parasitic resonance may contribute | Compare the switching waveform with local probe activity |
| Emissions change when an external cable moves | Cable coupling or resonance participates | Inspect cable current and the board-to-cable path |
| A rail improves at light load but worsens at full load | Source behavior or a filter's operating conditions change | Repeat the same measurement across load states; examine bias and temperature |
These are starting hypotheses assembled from the mechanisms discussed in TI's PCB emissions guide and the measurements described below. None assigns a noise mode solely from a frequency band.
2. Locate both the source and the path to an antenna
Make a three-column sketch: source → coupling path → emitting structure. For example, a converter may be the source, shared return impedance the coupling path, and a power cable the emitting structure. The closest component to a hot spot is not automatically the component that needs replacing.
For a two-conductor power connection, differential-mode current circulates through the outgoing and return conductors. Common-mode current flows in the same sense on both, returning through other paths such as chassis connections or parasitic capacitance. TI's mode definitions help distinguish the mechanisms before selecting a filter.
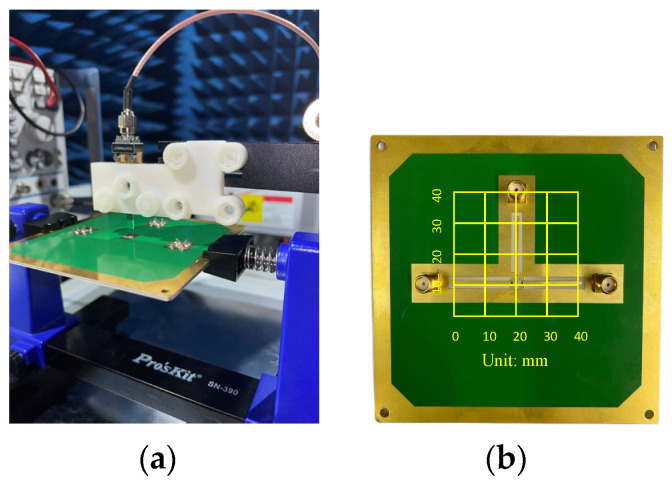
Tektronix's troubleshooting procedure combines near-field scans, cable-current measurements and antenna observations. Keep probe position and orientation fixed when comparing modifications. A local probe measures a local field; its reading is not interchangeable with a calibrated radiated-emissions result.
Use reversible changes to test the sketch. Disable one optional subsystem, change a permitted clock setting, or test an appropriate temporary cable ferrite. Log what changed and which other operating conditions moved with it. For instance, removing a cable can also stop communication and change processor activity, making the apparent improvement ambiguous.
Do not connect an ordinary ground-referenced oscilloscope probe indiscriminately to a switching node. Choose a voltage-rated probe and connection method appropriate to the circuit. Measurement loading and a long probe-ground connection can change the ringing being investigated. TI discusses probing considerations in its switch-node ringing study.
3. Correct the buck converter's hot loop
In a conventional buck converter, compare the on-state and off-state current paths. The rapidly commutating loop contains the local input capacitor, high-side switch and low-side switch or freewheel diode. The inductor's physical size alone does not identify this loop. ADI AN-139 explains the distinction and illustrates an LT8611 demonstration-board layout.
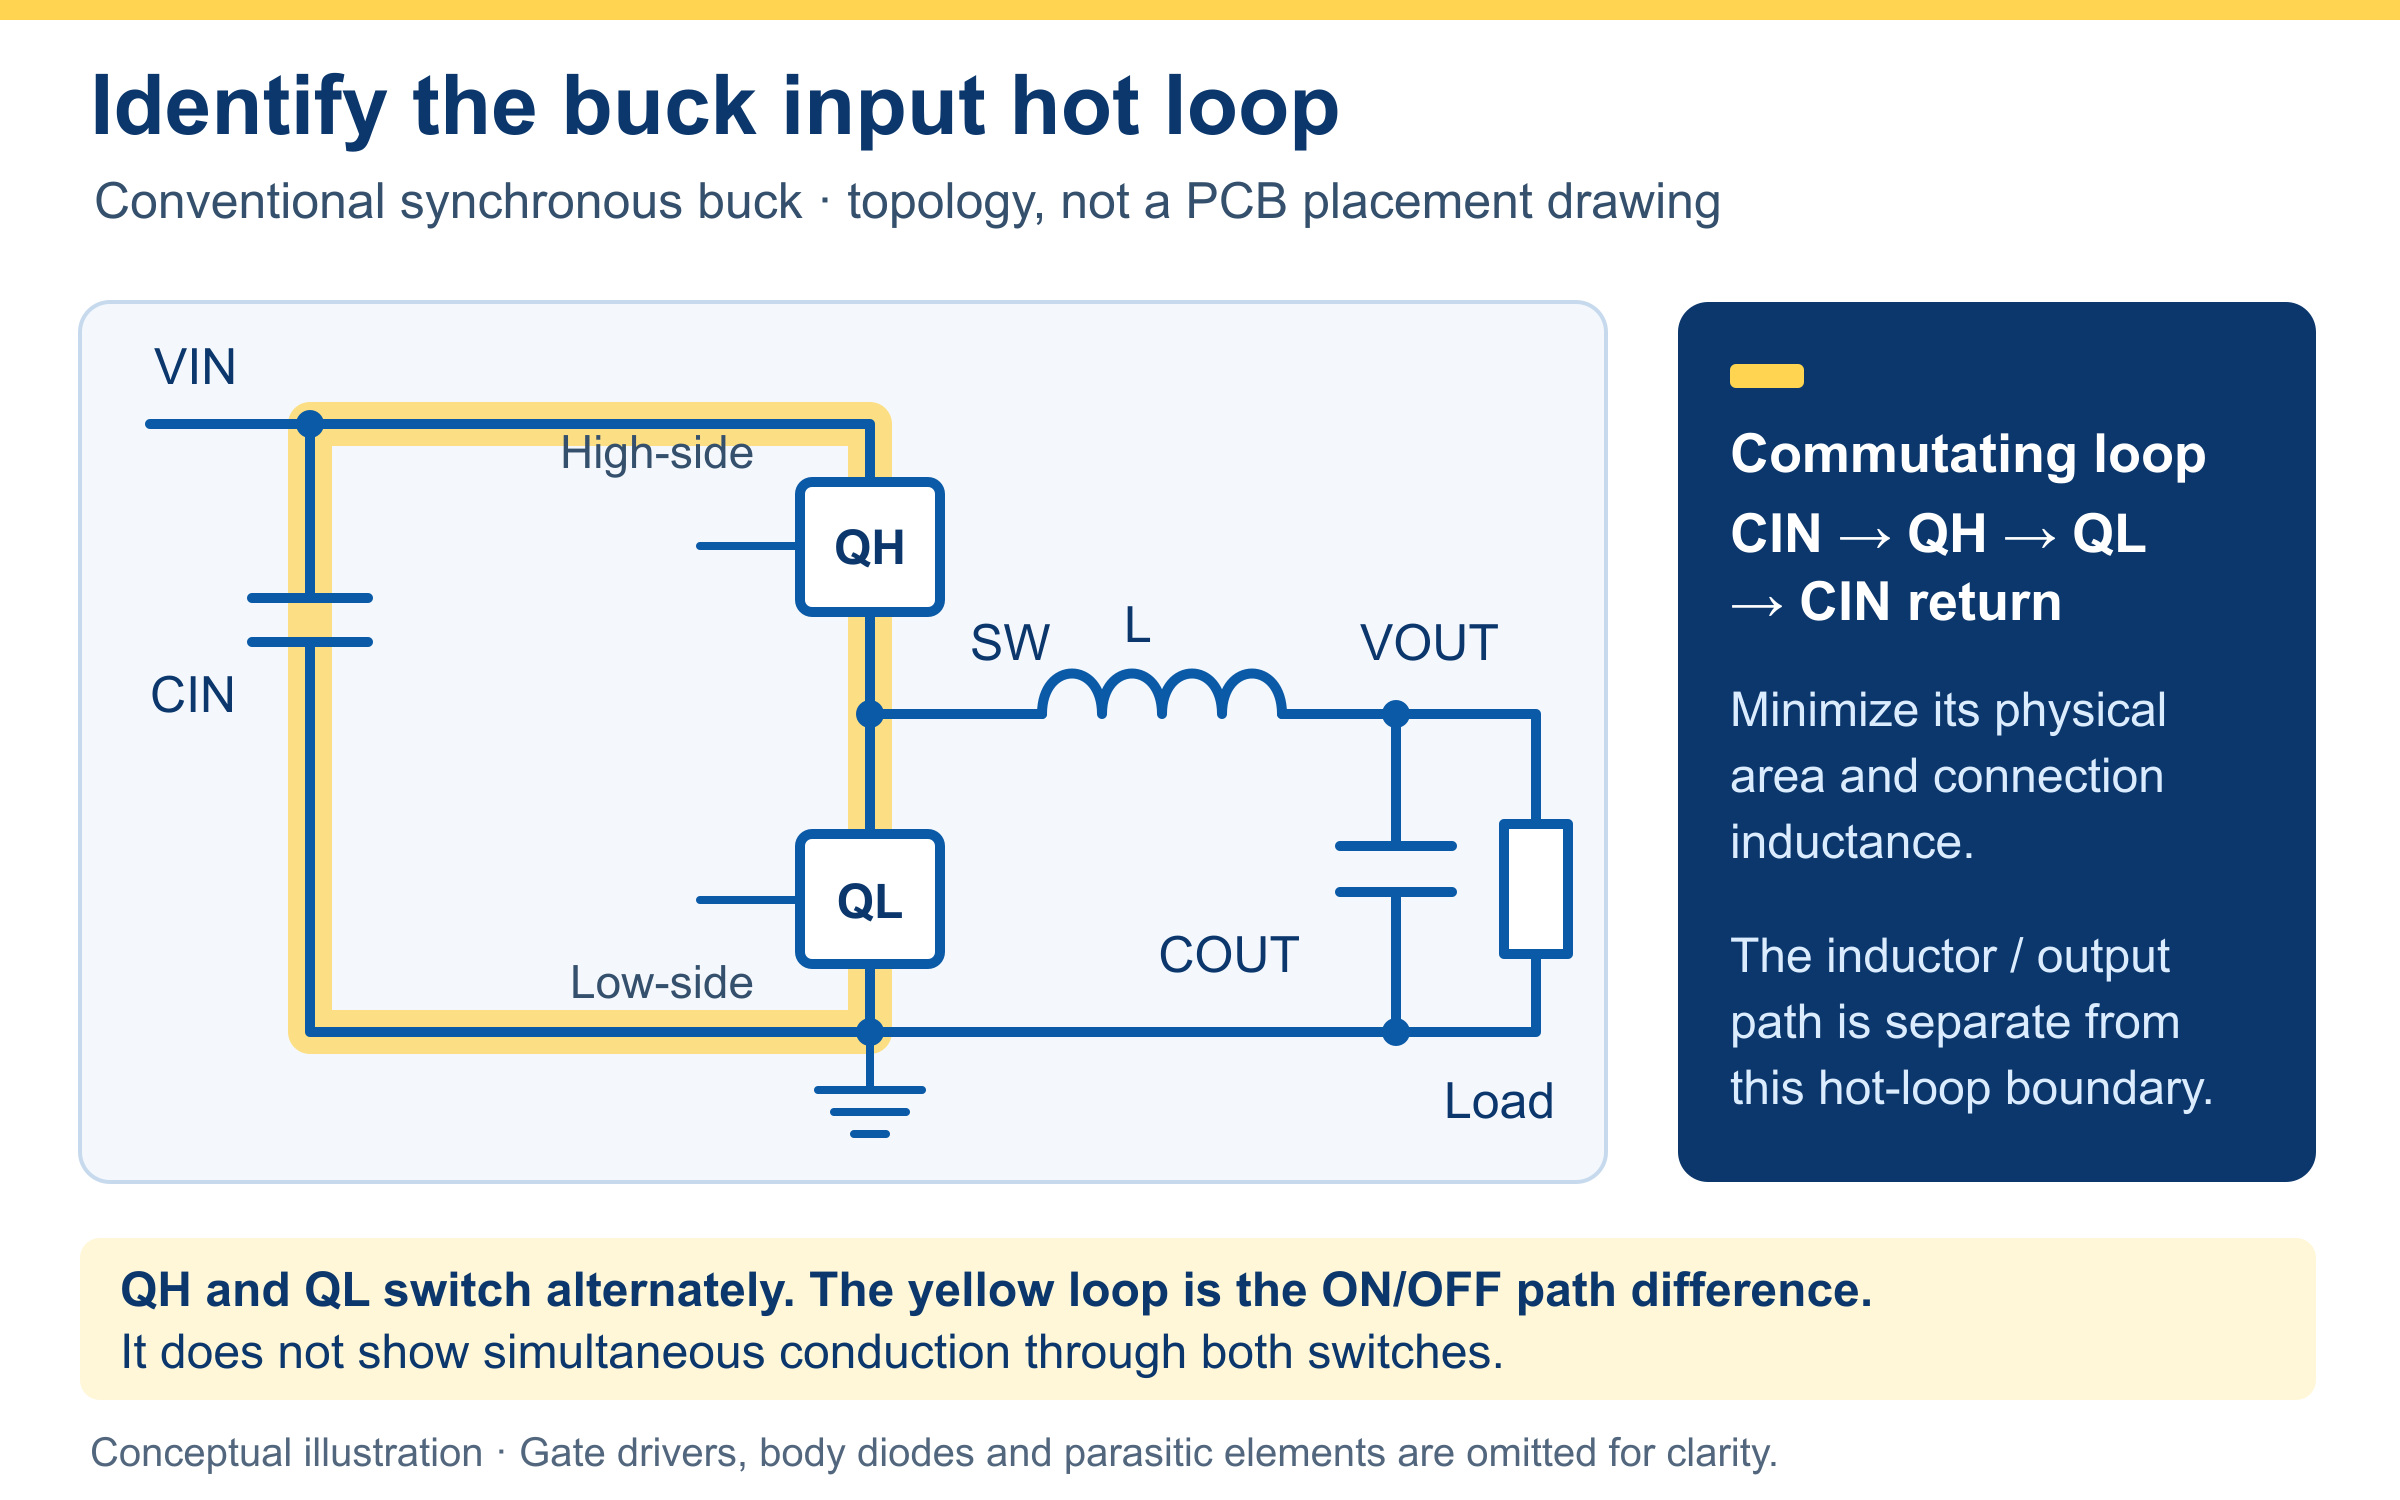
Compare the regulator's recommended layout against the actual copper, pads and reference planes. Check input-capacitor placement, the high-current return, switch-node copper near sensitive nets, and the separation of feedback routing from switching activity. Follow the device's grounding instructions: minimizing loop inductance is the objective, rather than applying a universal prohibition on every via.
An assumed calculation shows why loop geometry deserves attention. For an electrically small loop's far-field radiation, TI AN-2155 relates field strength to frequency, current and loop area. At the same frequency, harmonic current, orientation and measurement distance, suppose effective loop area changes from 20 mm² to 5 mm²:
Eafter/Ebefore = Aafter/Abefore = 5/20 = 0.25
ΔE = 20 log10(0.25) ≈ −12.0 dB
That is an idealized field ratio for one mechanism. It is not a predicted 12 dB improvement for a complete board: the real modification can change current, resonance and coupling, while another source may dominate the test.
If ringing remains, evaluate damping with the regulator's application guidance. A measured RC snubber or supported gate-drive adjustment can trade ringing against power loss. Check resistor heating, efficiency and switching behavior across conditions. The TI ringing study compares those trade-offs; its component values are not a universal snubber recipe.
4. Keep high-speed signal returns continuous
A signal trace and its return form a circuit. At high frequencies, the reference-plane current tends to concentrate near the signal path. A slot or plane edge can force a detour and enlarge the effective loop. TI SCAA082A, Figure 6, illustrates this relationship.
Review the reference under the entire route, including connector escapes and layer changes. If the route changes between two ground references that belong to the same ground domain, provide a nearby connection for the return. TI SLLA414A discusses reference-plane crossings and stitching vias. Its interface-specific guidance is more useful than an unexplained universal distance rule.
Keep noisy and sensitive functions apart by placement and by controlling their return paths. Cutting a ground plane to create a region labelled “quiet” can make a crossing worse. Also distinguish power ground, signal ground, chassis and protective earth on the schematic: a label such as PGND is not enough to determine their relationship.
Check clock drive strength and termination against the actual driver, load and route. A source resistor can help a suitable interconnect, but 22 Ω or 33 Ω is not automatically correct for every clock. The TI high-speed guide treats edge rate and interconnect behavior together. Oscillator grounding and keepouts should likewise follow the oscillator or IC manufacturer's layout instructions.
5. Select ferrite beads at the actual operating current
“120 Ω at 100 MHz” describes one impedance point under specified conditions. It does not describe the entire filter at full load. Inspect the impedance-frequency curve, its resistive and reactive components, DC-bias behavior, DC resistance and thermal limits.
ADI AN-1368 shows how bias current changes ferrite-bead impedance. Figure 8 illustrates this effect using the TDK MPZ1608S101A. Bias response is specific to the selected bead, so compare candidates using their own impedance curves at the expected operating current.
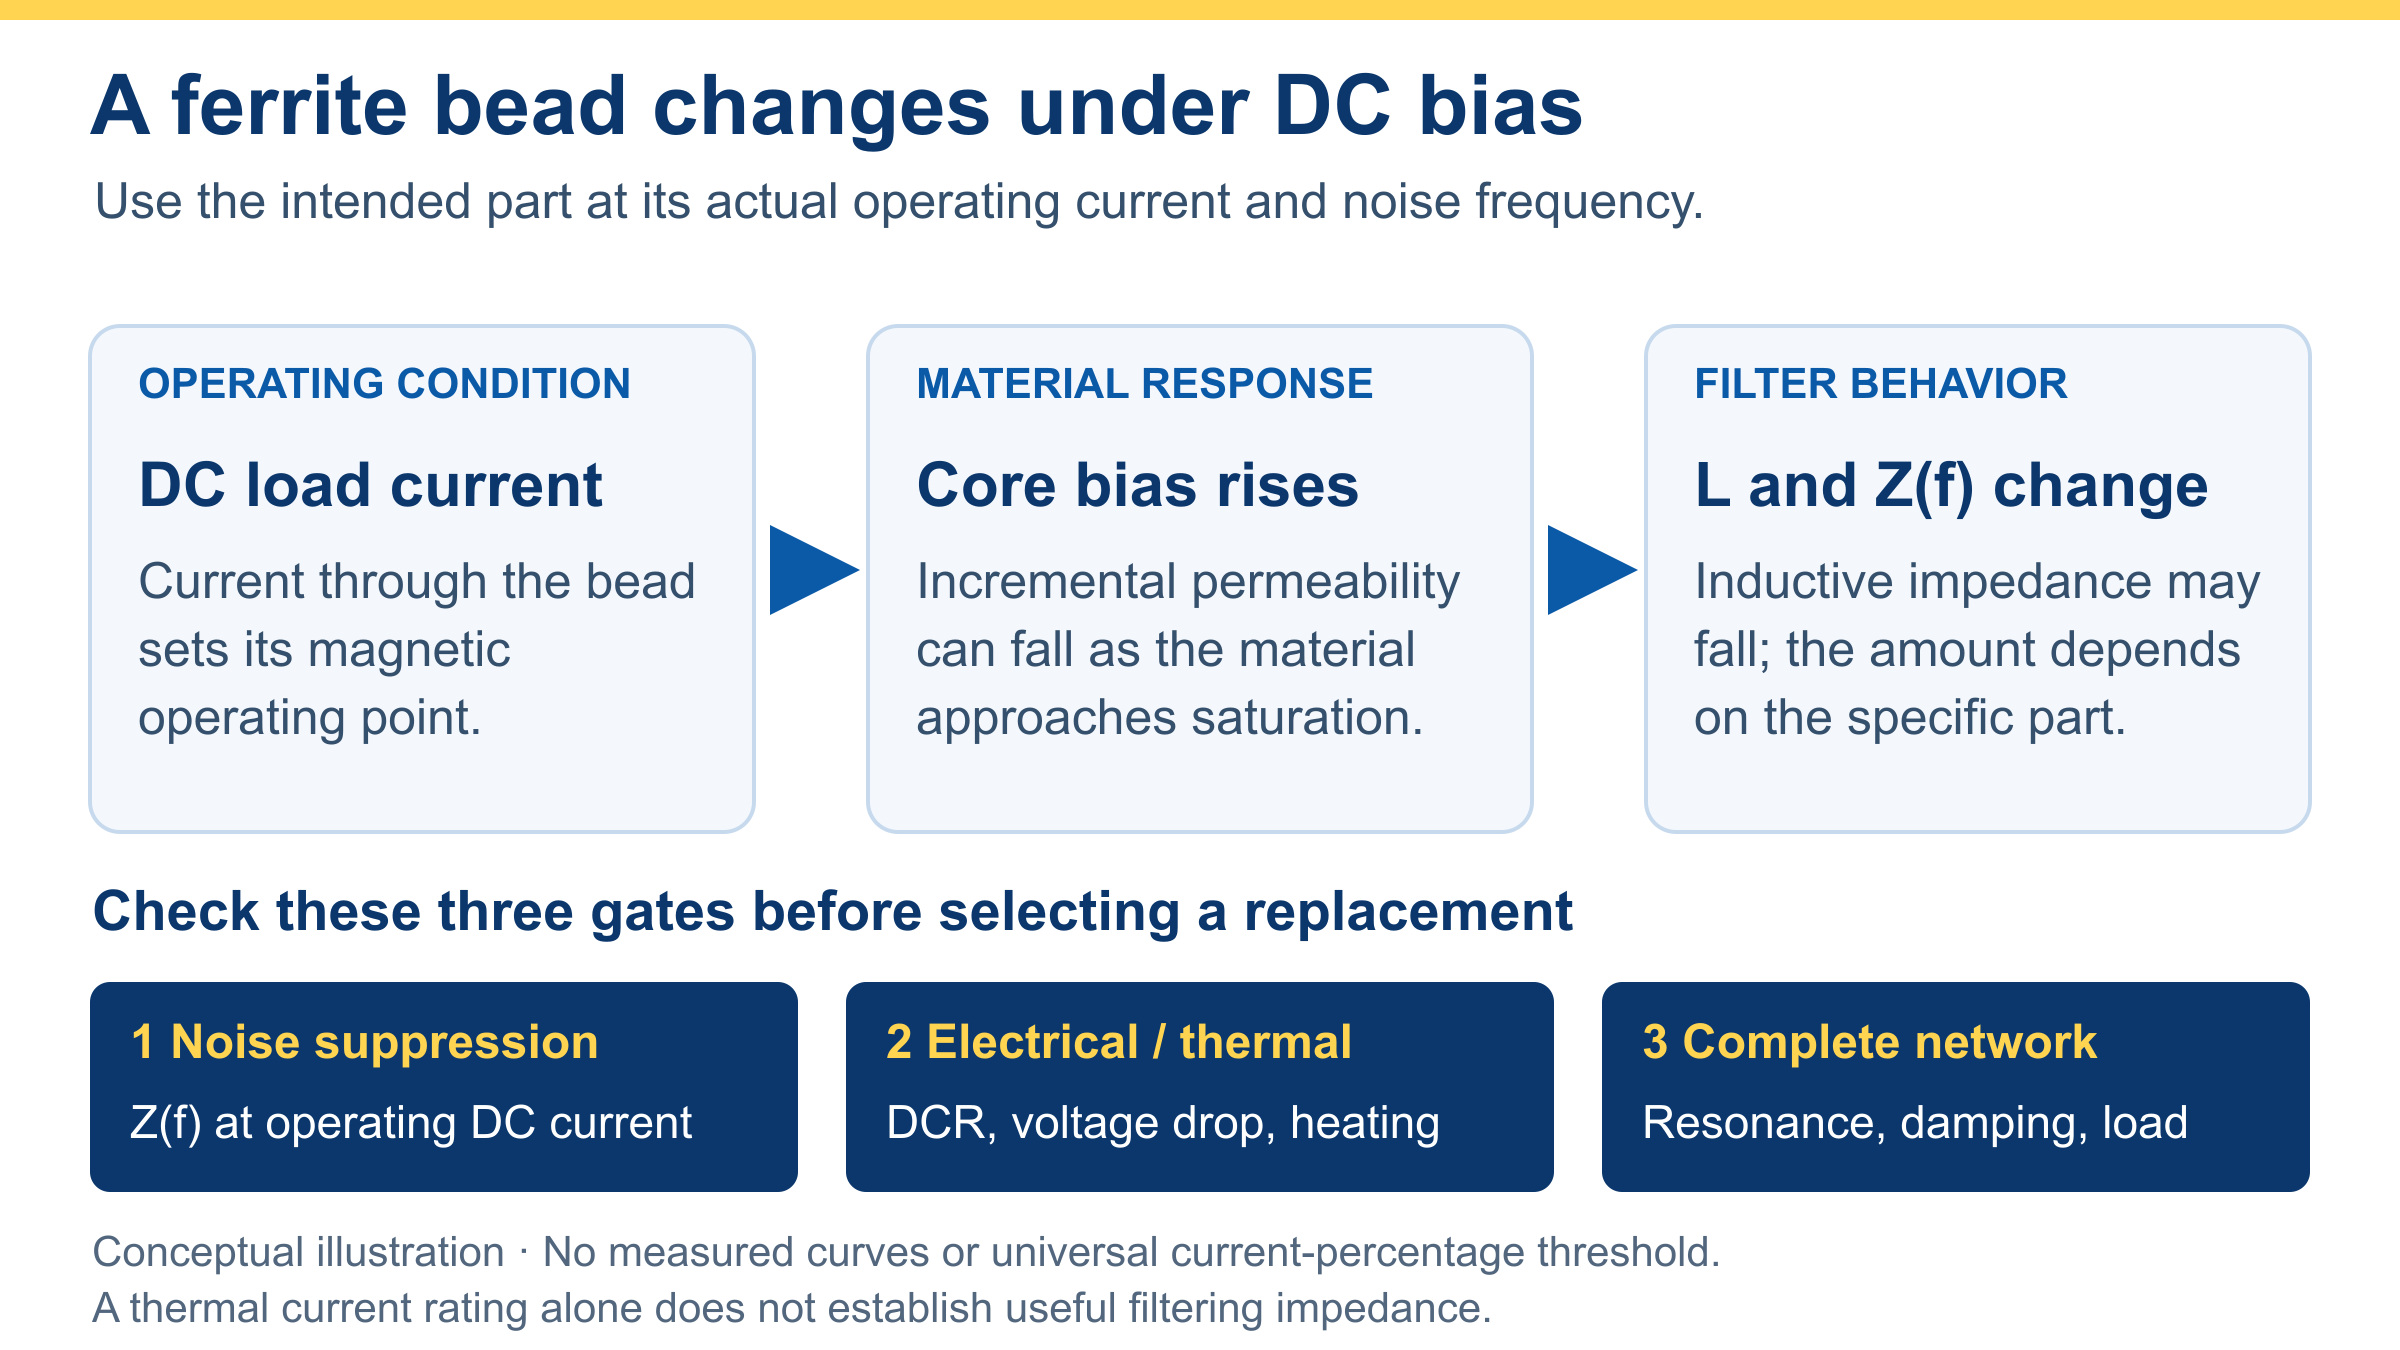
Include the surrounding capacitors and source/load impedances in the evaluation. A bead-capacitor network can introduce resonance, and filtering performance can change with load. Keep an undamped network from becoming a new problem. AN-1368 also examines this behavior; the curve at zero bias is insufficient evidence for approving a loaded rail.
For a converter input filter, examine stability as well as attenuation. TI AN-2162 explains how an LC input filter changes the source impedance seen by the converter and why damping can be necessary. An improved high-frequency scan should therefore be followed by startup and load-transient checks.
6. Choose capacitor impedance and mounting together
An MLCC's nominal capacitance is only part of its high-frequency behavior. ESR, ESL and the mounting connection determine the impedance seen by the noise current. Above self-resonance, a capacitor's impedance becomes inductive and rises; that does not by itself prove the installed part provides no useful bypassing. Murata's impedance guide explains the frequency regions.
For a simplified series-LC example, assume C = 100 nF and total L = 1 nH:
fSRF = 1/(2π√(LC)) ≈ 15.9 MHz
These are assumed circuit values, not fixed properties of an 0805 or 0402 package. Use the candidate's actual curves, effective capacitance at operating voltage and mounting geometry. For a more detailed rail-selection workflow, see the 100 nF decoupling capacitor guide.
Three-terminal capacitors can offer a useful alternative when the connection geometry supports them. Murata's mounting explanation examines the feedthrough path and grounding. Check the specified pin arrangement, ground connections and current rating; adding a long ground trace can compromise the intended low-inductance path.
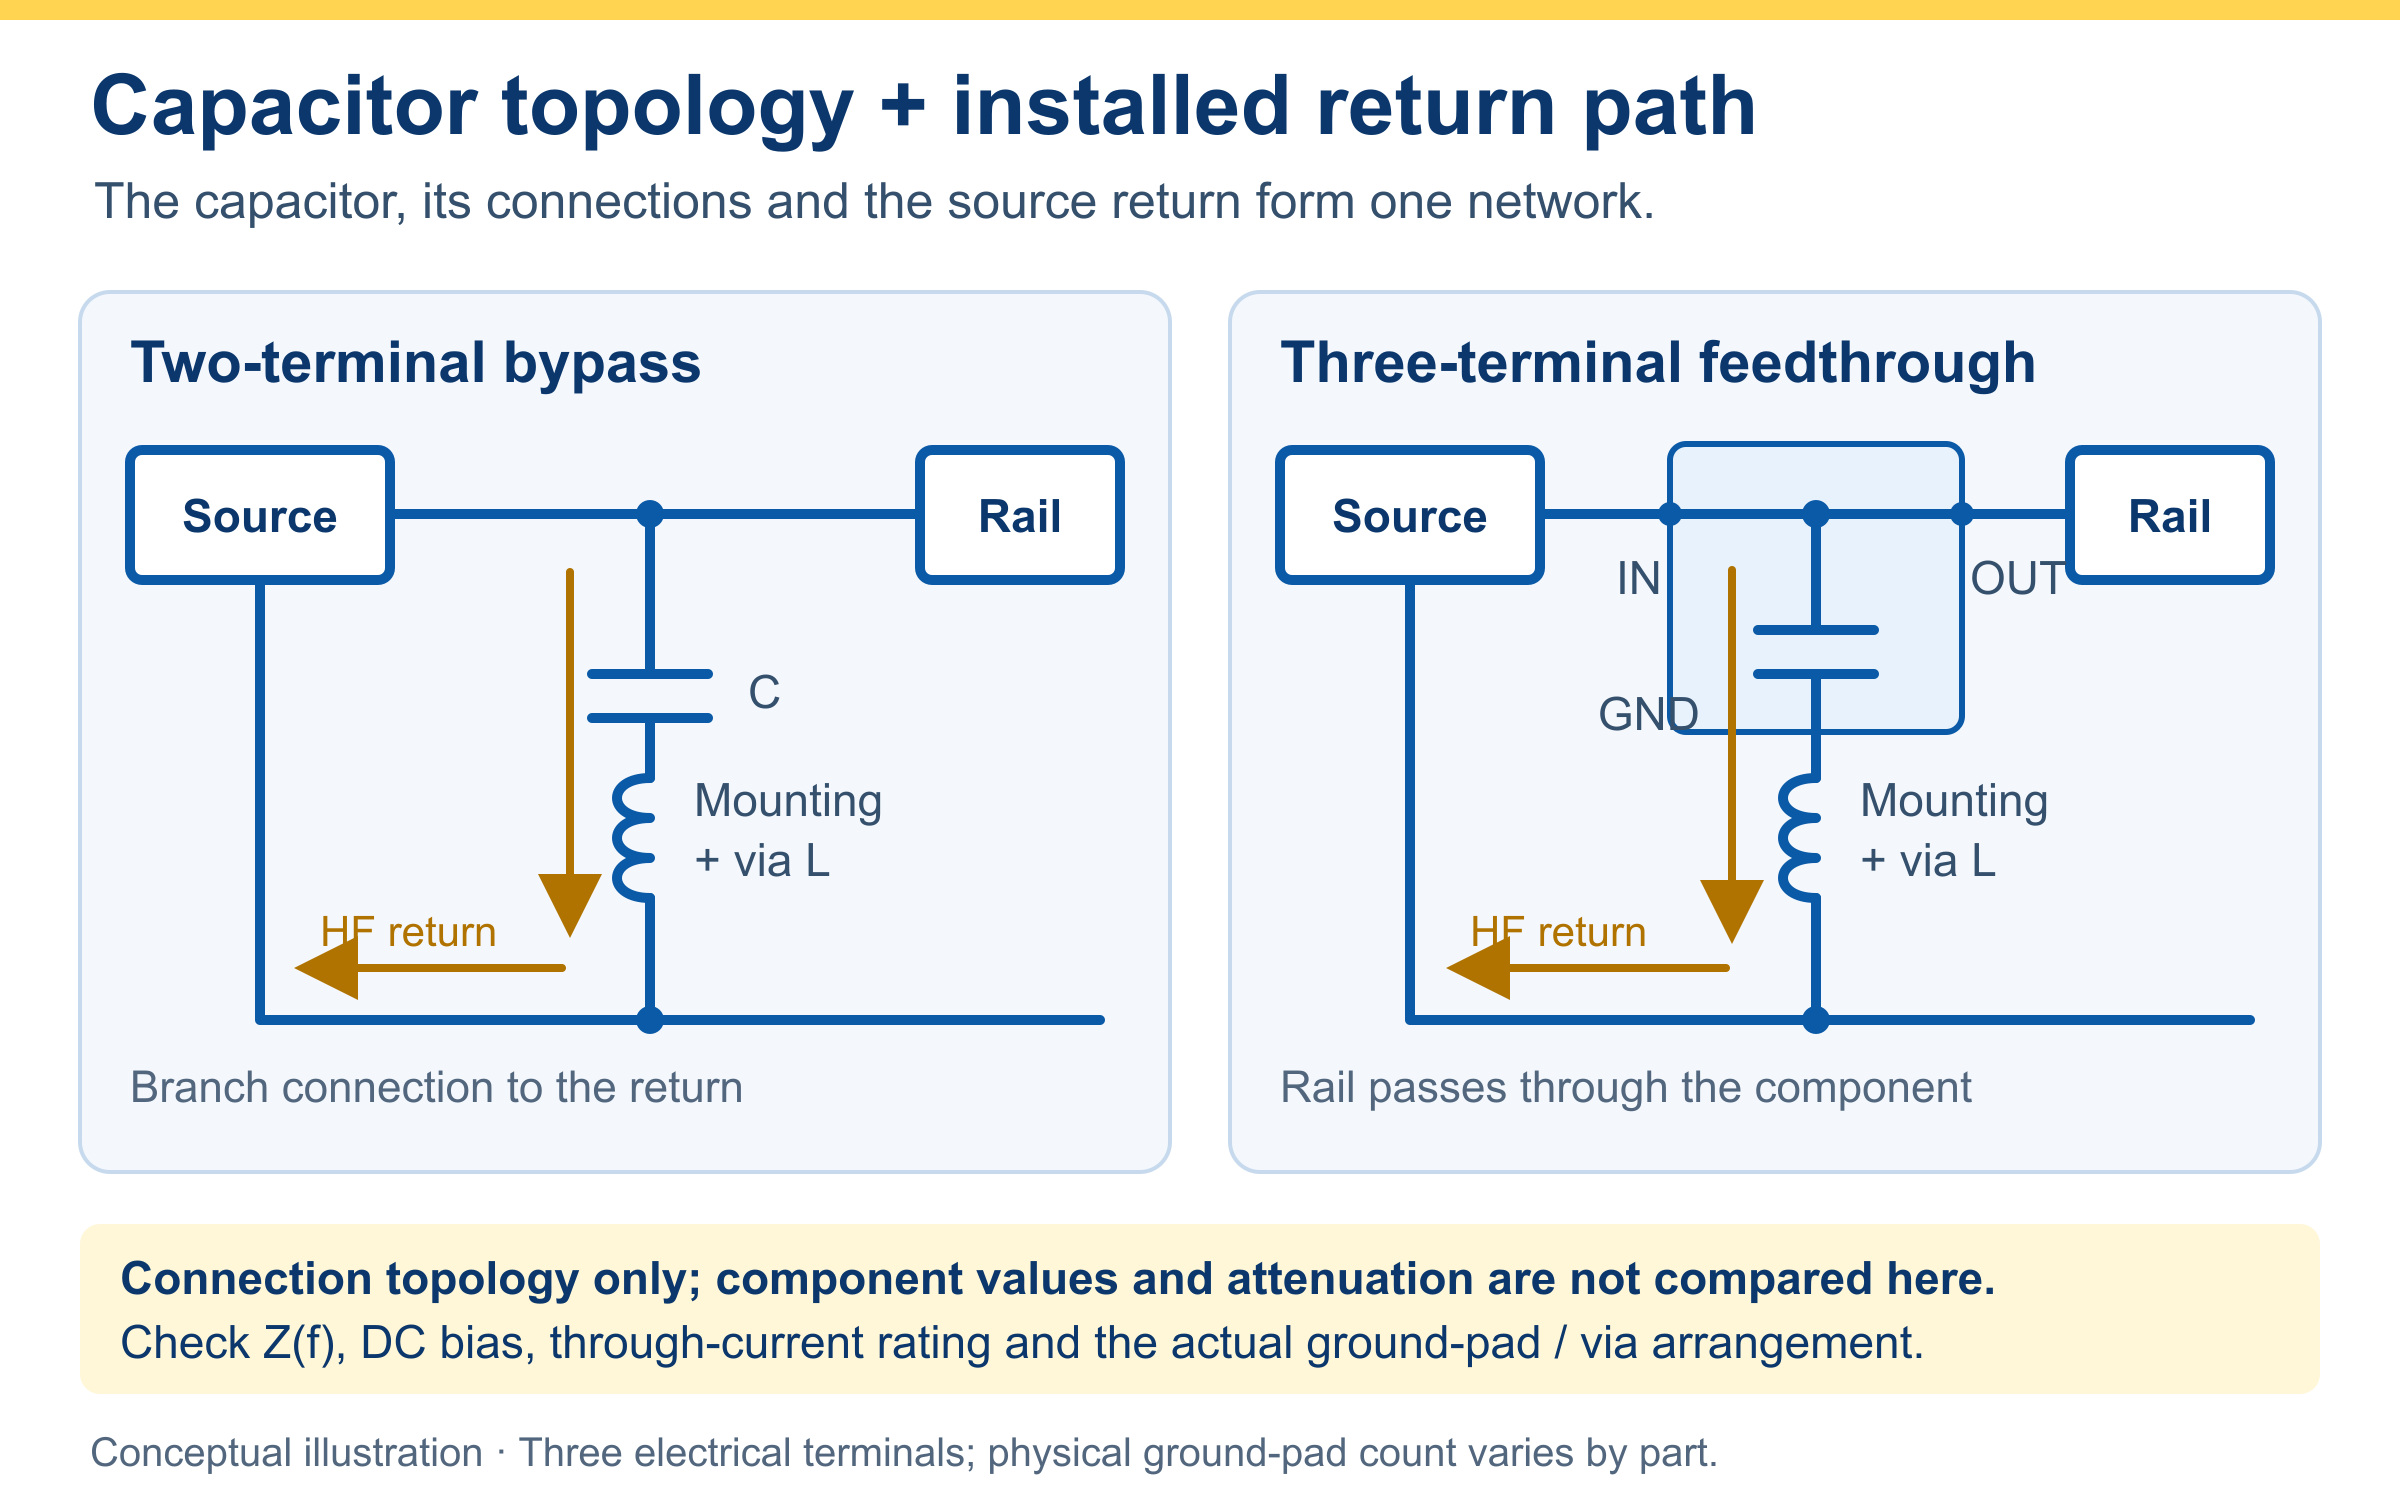
The Murata application example provides both filter and emissions comparisons. Use it to identify a candidate topology, then validate that topology with the board's own impedances and layout. Component insertion loss and finished-product emissions are different quantities.
7. Keep interface filtering compatible with the signal
A common-mode choke must attenuate the unwanted mode while preserving the wanted differential signal. Murata's selection guide considers impedance matching, differential-mode loss and common-mode loss. Select the part from the interface bandwidth and measured noise band, rather than from inductance alone.
Keep the filter and its return structure at the intended boundary. A filter placed far from a connector can leave a route where noise couples into the cable after the filtering point. Würth Elektronik's board-level EMI guidance illustrates how routing and coupling can undermine a filter.
Avoid making a universal rule that every USB, CAN, Ethernet or other port requires the same choke. Confirm the interface manufacturer's recommendations, then evaluate signal integrity with the filter fitted: eye opening or other applicable waveform limits, error behavior, mode transitions and temperature. A smaller spectrum peak is not sufficient if the data link becomes unreliable.
8. Turn the diagnosis into an EMI component shortlist
Write the missing evidence beside each candidate. This makes an RFQ useful to engineering and purchasing without suggesting that parts sharing an impedance, package or marketing label are interchangeable.
| Candidate | Evidence needed before selection | Approval check |
|---|---|---|
| Power-rail ferrite bead | Impedance versus frequency and bias; DCR; temperature/current limits | Noise change, voltage drop, temperature and rail behavior under load |
| Low-ESL or three-terminal capacitor | Effective capacitance; impedance curve; pin arrangement and mounting guidance | Installed bypass path and board-level result |
| Interface common-mode choke | Differential/common-mode response; interface recommendations; package and ratings | Signal integrity and emissions in the same configuration |
| Snubber resistor and capacitor | Measured resonance; suitable voltage, pulse and power ratings | Ringing, dissipation and efficiency across operating conditions |
| Low-EMI regulator | Exact device documentation, operating range and recommended layout | Electrical, thermal and system emissions validation |
As one architecture example, the LT8640S documentation describes Silent Switcher 2 and internal bypass capacitors. That can inform a redesign shortlist. It does not make LT8640S a drop-in replacement for another converter or certify the assembled product.
Before requesting parts, gather the complete manufacturer part number, quantity, target noise band, operating voltage/current/temperature, package and any required qualification. For approved alternatives, state which changes are permitted and which tests remain. The datasheet review workflow helps separate operating requirements from headline ratings.
9. Verify the modification and the complete product
Repeat the original measurement with the same operating state and setup, then test the other relevant states. Keep detector, bandwidth, attenuation, cable routing, fixture and probe geometry in the record. Check that the apparent improvement is not a noise-floor change, an altered workload or a disabled function.
For conducted-emissions comparisons, use the appropriate measurement network and procedure. TI AN-2162 describes how a LISN supports consistent source and measurement impedance. A bench comparison provides diagnostic evidence; the applicable compliance method still determines the final result.
In the published Murata comparison, changing the capacitor configuration changes the emission spectrum. Use the complete traces and test conditions to understand the result, then check the proposed filter with your own board stackup, load and cable configuration.
Use a record like this for each proposed fix:
| Record | What to save |
|---|---|
| Baseline | Board revision, firmware, workload, test method and original trace |
| Single modification | Exact component or copper change, photograph and schematic annotation |
| Comparable result | New trace with unchanged settings and an explanation of any setup difference |
| Functional regression | Startup, transient response, temperatures and affected interface behavior |
| Production decision | Final layout/BOM revision, residual margin and required compliance retest |
If a temporary modification works, convert it into a controlled design change. Include the copper and return-path correction in the PCB review, and keep the approved part number and measurement record with the BOM. This preserves the reason for the change when substitutions are discussed later.
10. Common PCB EMC and EMI questions
Does a broad peak prove the DC-DC converter is responsible?
No. It is a useful hypothesis, but attribution requires an experiment linking the peak to an operating event or circuit region. Check whether the result follows a permitted converter-mode change and whether the cable or antenna observation supports the same path.
Can I identify common-mode noise just from its frequency?
No. Common and differential modes describe relationships between currents or voltages and their return paths. Use an appropriate measurement arrangement to distinguish them; a fixed frequency split is not a reliable substitute.
Will adding more ground vias always improve EMI?
No. Review what the vias connect and which return they support. A nearby return connection can help a suitable layer transition, while unrelated via placement may leave the actual discontinuity unchanged. Preserve intentional isolation boundaries.
Do 3W spacing and the 20H rule guarantee compliance?
No. Spacing and plane geometry are design considerations, not a product-level pass criterion. Their effect depends on stackup, routing, edges and coupling. Prioritize the identified current path and verify the resulting product.
Should I change the PCB or add a filter first?
Choose the experiment that tests the suspected mechanism. A temporary filter can demonstrate that a conducted path matters; a layout correction can address the source or return discontinuity. Compare the final options for signal integrity, stability, temperature, BOM impact and repeatable emissions performance.