
No products in the cart.
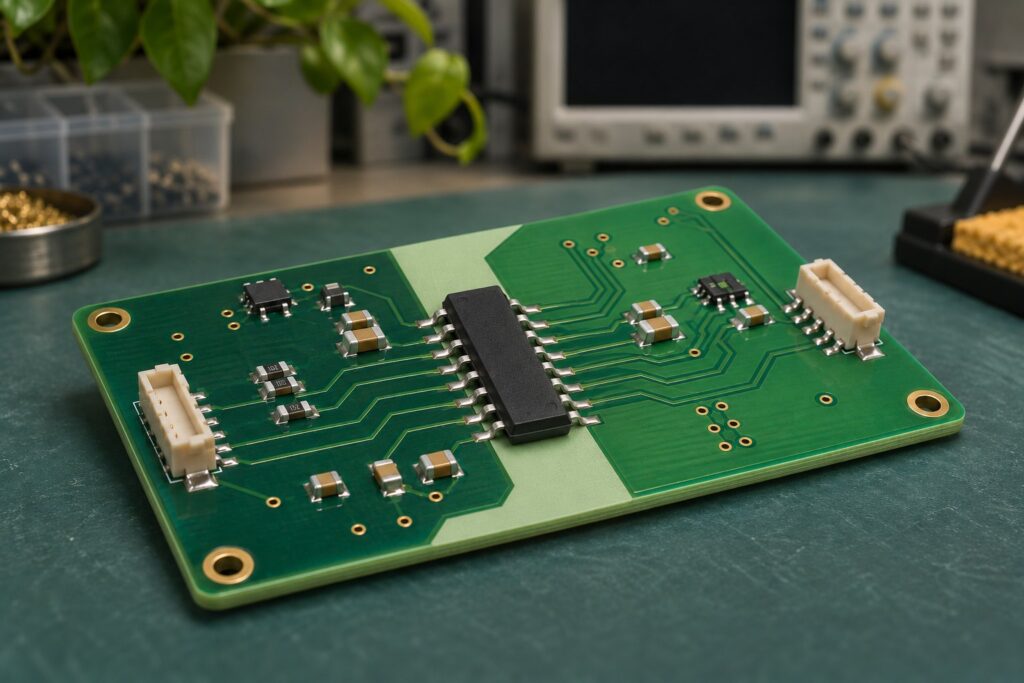
Digital isolator CMTI describes how fast the voltage between two isolated ground domains can change while the device continues to transfer the intended logic state under specified conditions. It is usually expressed in kV/µs. A high isolation-withstand voltage does not establish that a signal will remain correct during a fast switching edge.
For selection, start with the transient at the isolation barrier, then compare it with a guaranteed CMTI specification under relevant conditions. This guide shows how to estimate the slew rate, read a real datasheet entry, and turn the result into a useful review checklist.
What changes during a common-mode transient?
A digital isolator connects logic circuits that have separate ground references. The signal on each side is meaningful relative to its own local ground. During a common-mode transient, the potential difference between those grounds changes rapidly.
That distinction matters when investigating an intermittent error. A clean input waveform measured against the input-side ground does not, by itself, describe what happened between the two ground domains. Put both observations in the same event record: the intended logic transition and the voltage disturbance across the barrier.
Capacitance between the isolated domains provides a path for transient current. Analog Devices describes this mechanism and tests both transient polarities with the inputs held high and low in its CMTI measurement article. The historical device comparison in that article should not be treated as a ranking of all current isolation technologies.

In a motor-drive controller, the first useful question is therefore specific: what voltage change appears between the two grounds of this particular isolator? A power-switch waveform elsewhere on the board may provide a clue, but it is not automatically the waveform across every isolation channel.
CMTI, isolation voltage, and data rate answer different questions
Keep the following entries separate in a component comparison:
| Specification | What it helps evaluate | What still needs a separate check |
|---|---|---|
| CMTI, in kV/µs | Signal operation during a rapid change between isolated grounds | Transient amplitude, waveform, operating conditions, and board behavior |
| Isolation-withstand voltage, often in V RMS | Insulation withstand under a defined test | Continuous working voltage and signal integrity |
| Working voltage | Permitted long-term electrical stress under the stated conditions | Short-duration disturbances and application insulation requirements |
| Data rate and propagation delay | Signal throughput and timing | Immunity to disturbances between ground domains |
TI separates insulation, timing, and CMTI in its Digital Isolator Design Guide, Section 3.1. That separation is useful in an RFQ as well: requesting a “5 kV isolator” leaves several important selection questions unanswered.
A practical comparison sheet should have separate columns for insulation requirements, CMTI conditions, channel direction, timing, supplies, package, and default state. An attractive number in one column cannot close an unresolved requirement in another.
Calculate dv/dt without hiding the voltage window
For a specified segment of a waveform, the average slew rate is:
Average slew rate = |ΔV| / Δt
If voltage is in volts and time is in nanoseconds, the numerical result in V/ns is also the result in kV/µs:
1 V/ns = 1 kV/µs
Consider an illustrative linear transition from 0 V to 800 V in 10 ns:
800 V / 10 ns = 80 V/ns = 80 kV/µs
For that same ideal straight ramp, the 20–80% segment changes by 480 V in 6 ns, also giving 80 kV/µs. Dividing the full 800 V by the 6 ns segment time would produce an inconsistent result. The voltage difference and time interval must describe the same endpoints.

| Assumed linear voltage change | Time over that same change | Calculated average slope |
|---|---|---|
| 400 V | 20 ns | 20 kV/µs |
| 800 V | 10 ns | 80 kV/µs |
| 800 V | 5 ns | 160 kV/µs |
These are arithmetic examples, not measured board waveforms or operating limits. Real edges can contain ringing and changing slope. An average over a selected interval may miss a steeper local segment.
Record the measurement window alongside the answer. TI’s more recent CMTI application brief discusses a 20–80% measurement window, while its older SLUA909 report discusses a different convention and measurement limitations. Use the method associated with the device evidence being evaluated; do not silently mix intervals.
Why small capacitance can still matter
The ideal-capacitor relationship is i = C × dv/dt. With an assumed 1 pF coupling capacitance and the illustrative 80 kV/µs slope:
i = 1 × 10⁻¹² F × 80 × 10⁹ V/s = 0.08 A = 80 mA
This is a simplified instantaneous displacement-current example. It is not the isolator’s supply current, an insulation-leakage rating, or proof that 80 mA enters an output pin. A real board has multiple coupling paths and impedances. The calculation helps explain why reducing unwanted coupling and controlling return paths deserve attention even when DC isolation exists.
Read the CMTI row with its test conditions
As a document-reading example, the ISO774x datasheet, revision K, August 2026, lists 85 kV/µs minimum and 100 kV/µs typical in its 3.3 V electrical-characteristics table. The table specifies both supplies at 3.3 V ±10%, the input at its supply or 0 V, and a 1200 V common-mode test voltage; its recommended operating conditions also apply. See Section 5.11 and Figure 6-4.
The minimum and typical columns serve different purposes. Use a guaranteed limit that covers the intended operating conditions for a specification comparison. A typical value is useful context, but it does not replace that limit.
For the 80 kV/µs arithmetic example above, 85/80 is approximately 1.06. That ratio alone does not establish adequate margin. Measurement uncertainty, a steeper waveform segment, a different test condition, or a changing application environment may matter more than the apparent numerical gap. There is no universal margin multiplier established by this calculation.
Static and dynamic tests
A static CMTI test holds the input high or low while applying the transient. A dynamic test examines operation when an input transition occurs near the disturbance. TI’s SLUA909 report, Section 2, explains this distinction and discusses errors such as missing pulses and abnormal delay.

For a clock, strobe, or PWM signal, ask what evidence covers the moment when useful data changes. If the source only describes a held-high or held-low test, do not relabel it as dynamic qualification.
Before comparing two numbers, capture:
- The minimum or typical status of each value.
- The transient amplitude, polarity, and slope definition.
- Input state or switching pattern.
- Supply voltages, temperature range, and output load.
- The output error criterion and measurement setup.
If a condition is absent, record it as unresolved and ask for the relevant document. A blank condition is not evidence of a more demanding test.
Separate a CMTI problem from nearby circuit problems
When an interface fails during power-stage switching, replacing the isolator immediately can hide the real cause. Build a short event record first.
| Observation | Next item to investigate |
|---|---|
| Input logic changes unexpectedly before the barrier | Source signal, local ground reference, and input routing |
| Output-side supply dips during the disturbance | Decoupling, regulator behavior, and local return path |
| Error occurs only with one probe connection | Probe loading, reference connections, and the measurement arrangement |
| Missing or shifted edge coincides with a ground-domain transient | CMTI conditions and the complete timing path |
| Error occurs only during startup or shutdown | Supply sequence and default-state behavior |
This table is a troubleshooting sequence, not a diagnosis from symptoms alone. Save the schematic revision, firmware state, probe configuration, and operating point with each capture so that the observation can be repeated.
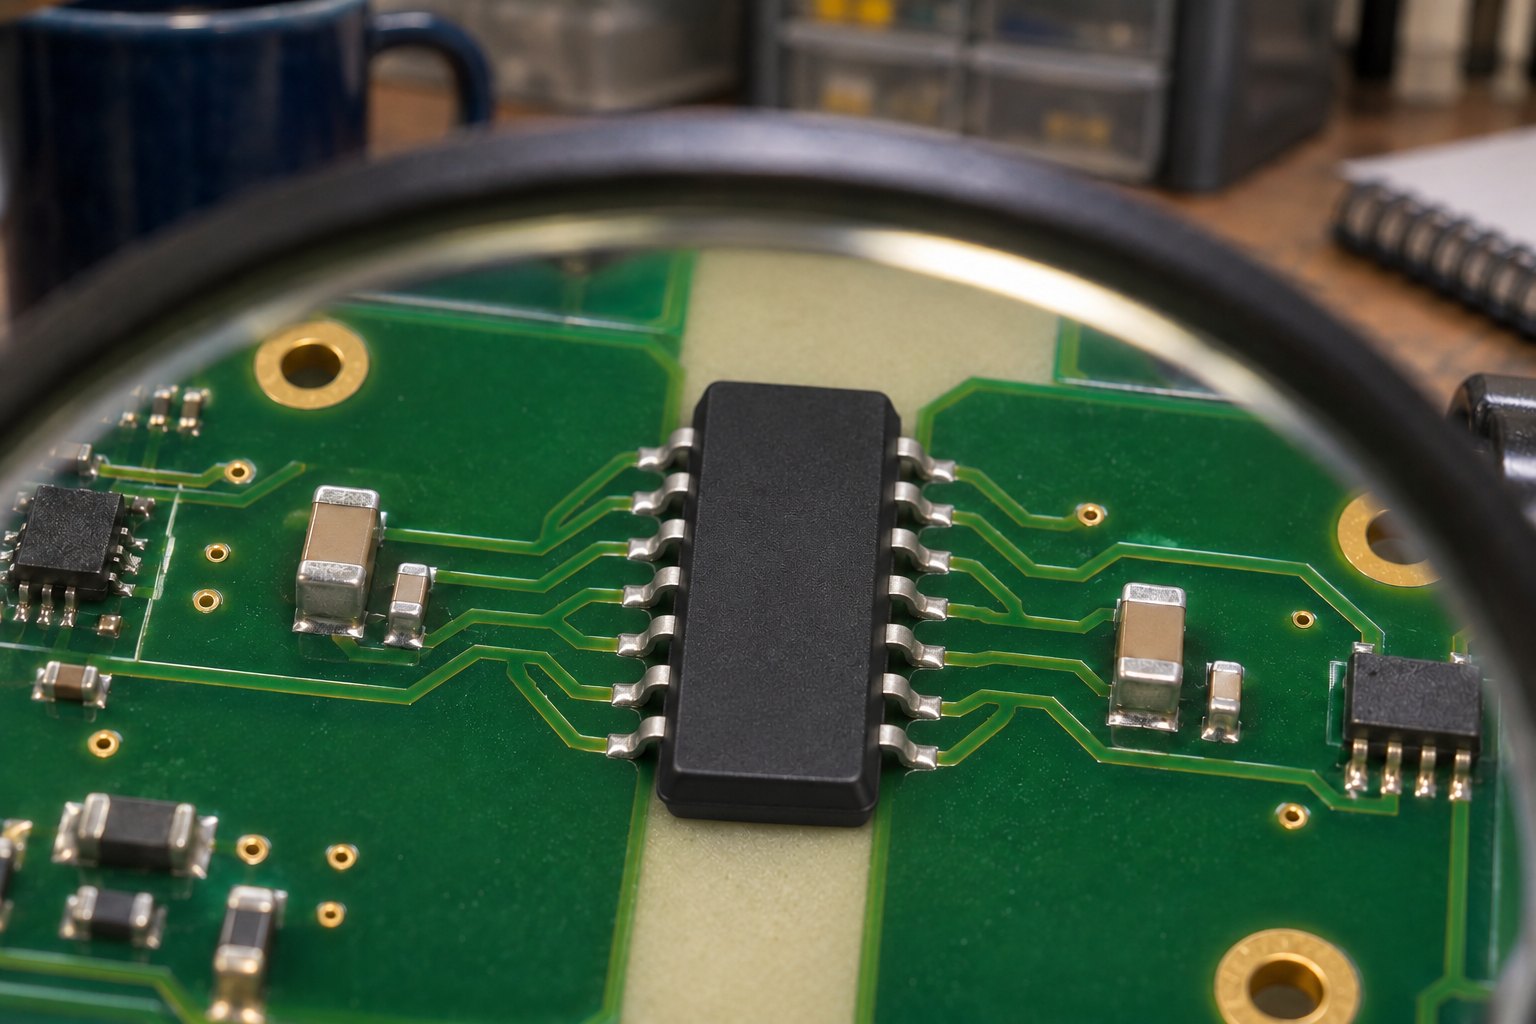
Review the board with both domains in view: bypass-capacitor placement, supply loops, coupling from switching conductors, and the return path of connected equipment. Preserve the required insulation separation while making changes. An improvement in one waveform is insufficient if it compromises another design requirement.
High-voltage transient measurements require appropriately rated equipment and a suitable test arrangement. Connecting an ordinary grounded instrument across separate domains can alter the circuit and defeat the isolation being evaluated. Follow the equipment and device documentation for the actual setup.
If the application instead starts with a field sensor and an optocoupler, our 24 V industrial digital-input selection guide covers the input-current and logic-threshold decisions that precede a complete interface review.
Build a shortlist that an engineer can actually review
For each candidate, attach a compact evidence sheet to the full manufacturer part number:
- Application waveform: expected or measured amplitude, positive and negative slopes, interval definition, and uncertainty.
- Device evidence: datasheet revision, guaranteed CMTI entry, conditions, and relevant dynamic test information.
- Interface requirements: channel directions, supplies, logic levels, pulse width, and timing budget.
- Insulation requirements: working voltage, package separation, and applicable application requirements.
- Board validation: remaining tests, observed errors, and the owner of application approval.

This makes a proposed alternative reviewable. A supplier can identify candidates from a requirement sheet, but a matching CMTI headline does not establish pin compatibility or application approval.
Browse the digital isolator category to develop a candidate list. For an inquiry, send the exact part number, quantity, package, and the conditions above through ApexComponent’s inquiry form. Availability and proposed alternatives require confirmation for that request.
Frequently asked questions
Is CMTI the same as switching frequency?
No. Switching frequency describes how often events occur; dv/dt describes how quickly voltage changes during an edge. Two circuits operating at the same frequency can have very different edge slopes.
Does a higher isolation rating guarantee better CMTI?
No. Evaluate the insulation and signal-immunity specifications separately, with their respective conditions.
Can a dv/dt calculation replace a test?
No. It is useful for estimating a requirement and checking units. It does not capture every coupling path, measurement error, operating condition, or logic failure mode.
Should I choose the device with the largest CMTI value?
Only after checking that the value is comparable and the other requirements are met. Channel direction, supply range, default state, timing, package, and insulation constraints can still exclude the part.
Sources and method
Prepared on 17 November 2026 using manufacturer documentation: TI’s Digital Isolator Design Guide (SLLA284G), ISO774x datasheet (SLLSEP4K), SLUA909, SLUAAZ0A, and Analog Devices’ CMTI measurement article linked above. The calculations and review tables are original editorial examples. No bench measurements were performed for this article. Photographic scenes are AI-generated concepts; the diagrams illustrate definitions and assumptions, not measured product results.